Meet Insights.
A flexible suite of reporting tools to access your data, your way.


What's Included with RocketRez Insights?
Access real-time insights with prebuilt dashboards and reports, empowering data-driven decisions for your business.
Export data effortlessly to Excel or CSV, enabling detailed analysis, data manipulation, and custom reporting.
Unlock advanced analytics and create custom visualizations with seamless Power BI integration.
Discover the power of RocketRez Insights
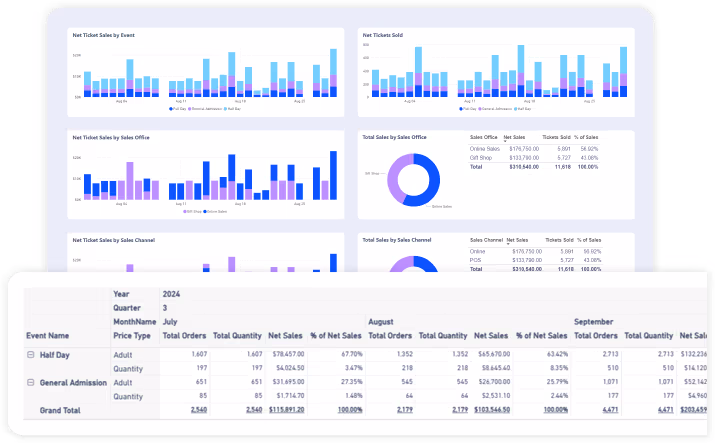
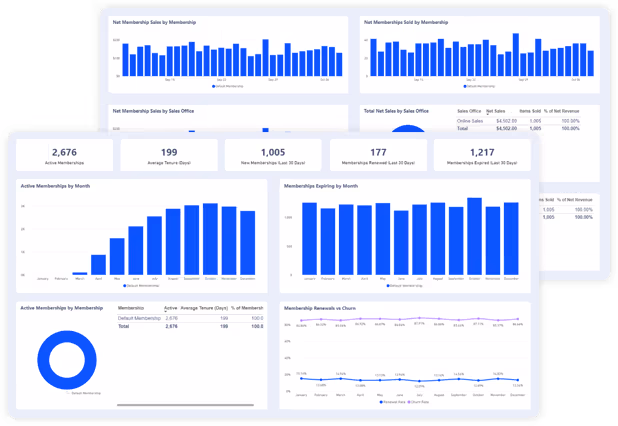
Prebuilt Dashboards and Reports
Gain instant, customizable insights into your entire operation with real-time, tailored dashboards that keep you informed and ready to act.


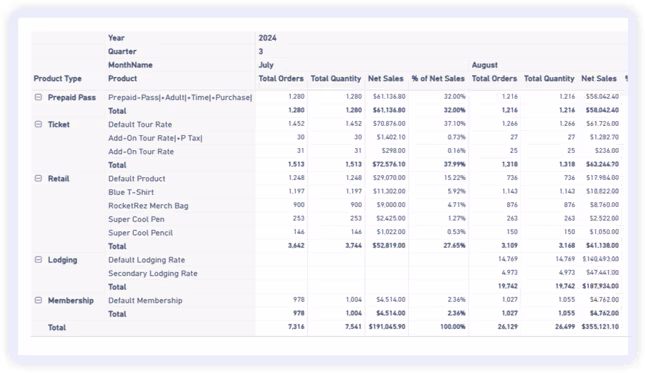
Flexible Data Export
Easily export and analyze your data in the formats you need, offering flexibility to create detailed reports and seamlessly integrate with your existing tools.
Power BI Integration


API Access
Ensure your data flows smoothly across systems with RocketRez’s flexible API, allowing for seamless integration and future-proof data management.
Frequently Asked Questions about Insights
What is RocketRez Insights, and why does it matter for my business?
RocketRez Insights is the most flexible reporting suite in the attractions industry. It gives operators the ability to track ticket sales, revenue by source, and more—without needing to export data to spreadsheets or juggle disconnected systems.
Whether you're a single-location zoo or a multi-venue cruise line, Insights helps you run your business with real data in real time.
What kinds of dashboards or reports are included out of the box?
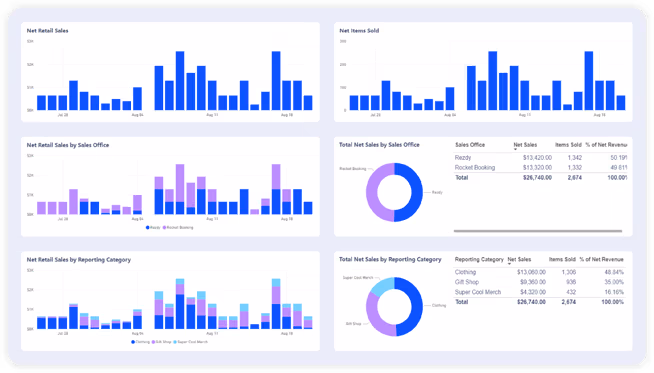
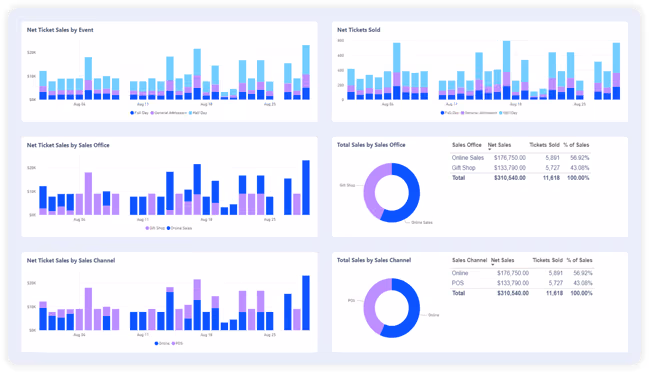
Insights includes a library of prebuilt dashboards tailored to common attraction KPIs:
- Ticket Scanning Dashboard – Tracks check-in rates by time, gate, and ticket type.
- Headcount Overview – Breaks down attendance by hour, day, ticket type, and channel.
- Net Revenue Dashboard – Understand true revenue after discounts, comps, or refunds.
- Retail & F&B Sales Reports – Track sales performance by product or location.
You can start using these dashboards immediately—no setup required.
Can I compare performance across locations or departments?
Yes. Multi-location operators can easily compare metrics across sites. You can drill down into performance by department (e.g., ticketing, retail, food and beverage) or staff member.
How do Insights reports help me manage busy season or plan staffing?
Using historical data, you can forecast attendance, optimize staffing levels, and identify peak times for upselling. Operators use this data to increase staffing precision and reduce overtime.
What technical expertise is needed to use RocketRez Insights?
Standard dashboards are fully visual and require no technical skill. For custom dashboards or Power BI use, your IT team or data analyst can plug in to our APIs.
Can I export data or integrate with other tools?
Yes. We offer:
- Direct data access for your analysts
- API integrations for BI or visualization tools
- Power BI-ready datasets
- CSV exports for one-off reporting
This makes it easy to use RocketRez data in tools like Tableau, Snowflake, Looker, or your own dashboards.
How often is data refreshed?
Data is refreshed hourly, giving you near-real-time insights into daily operations—ideal for managing check-ins, resolving staff issues, or adjusting on the fly.
Is Insights secure and permission-controlled?
Yes. Access is fully permission-based. Your team can control which users or departments see which dashboards or metrics, supporting compliance and data governance best practices.
How does Insights help me grow revenue?
By identifying your best-performing sales channels, upsell opportunities, or underutilized assets, Insights gives operators the visibility to optimize pricing, promotions, and capacity decisions that directly impact top-line growth.
Want a demo of Insights and the full RocketRez platform?
Discover the features that can transform your business operations, elevate customer experiences, and significantly increase your revenue.